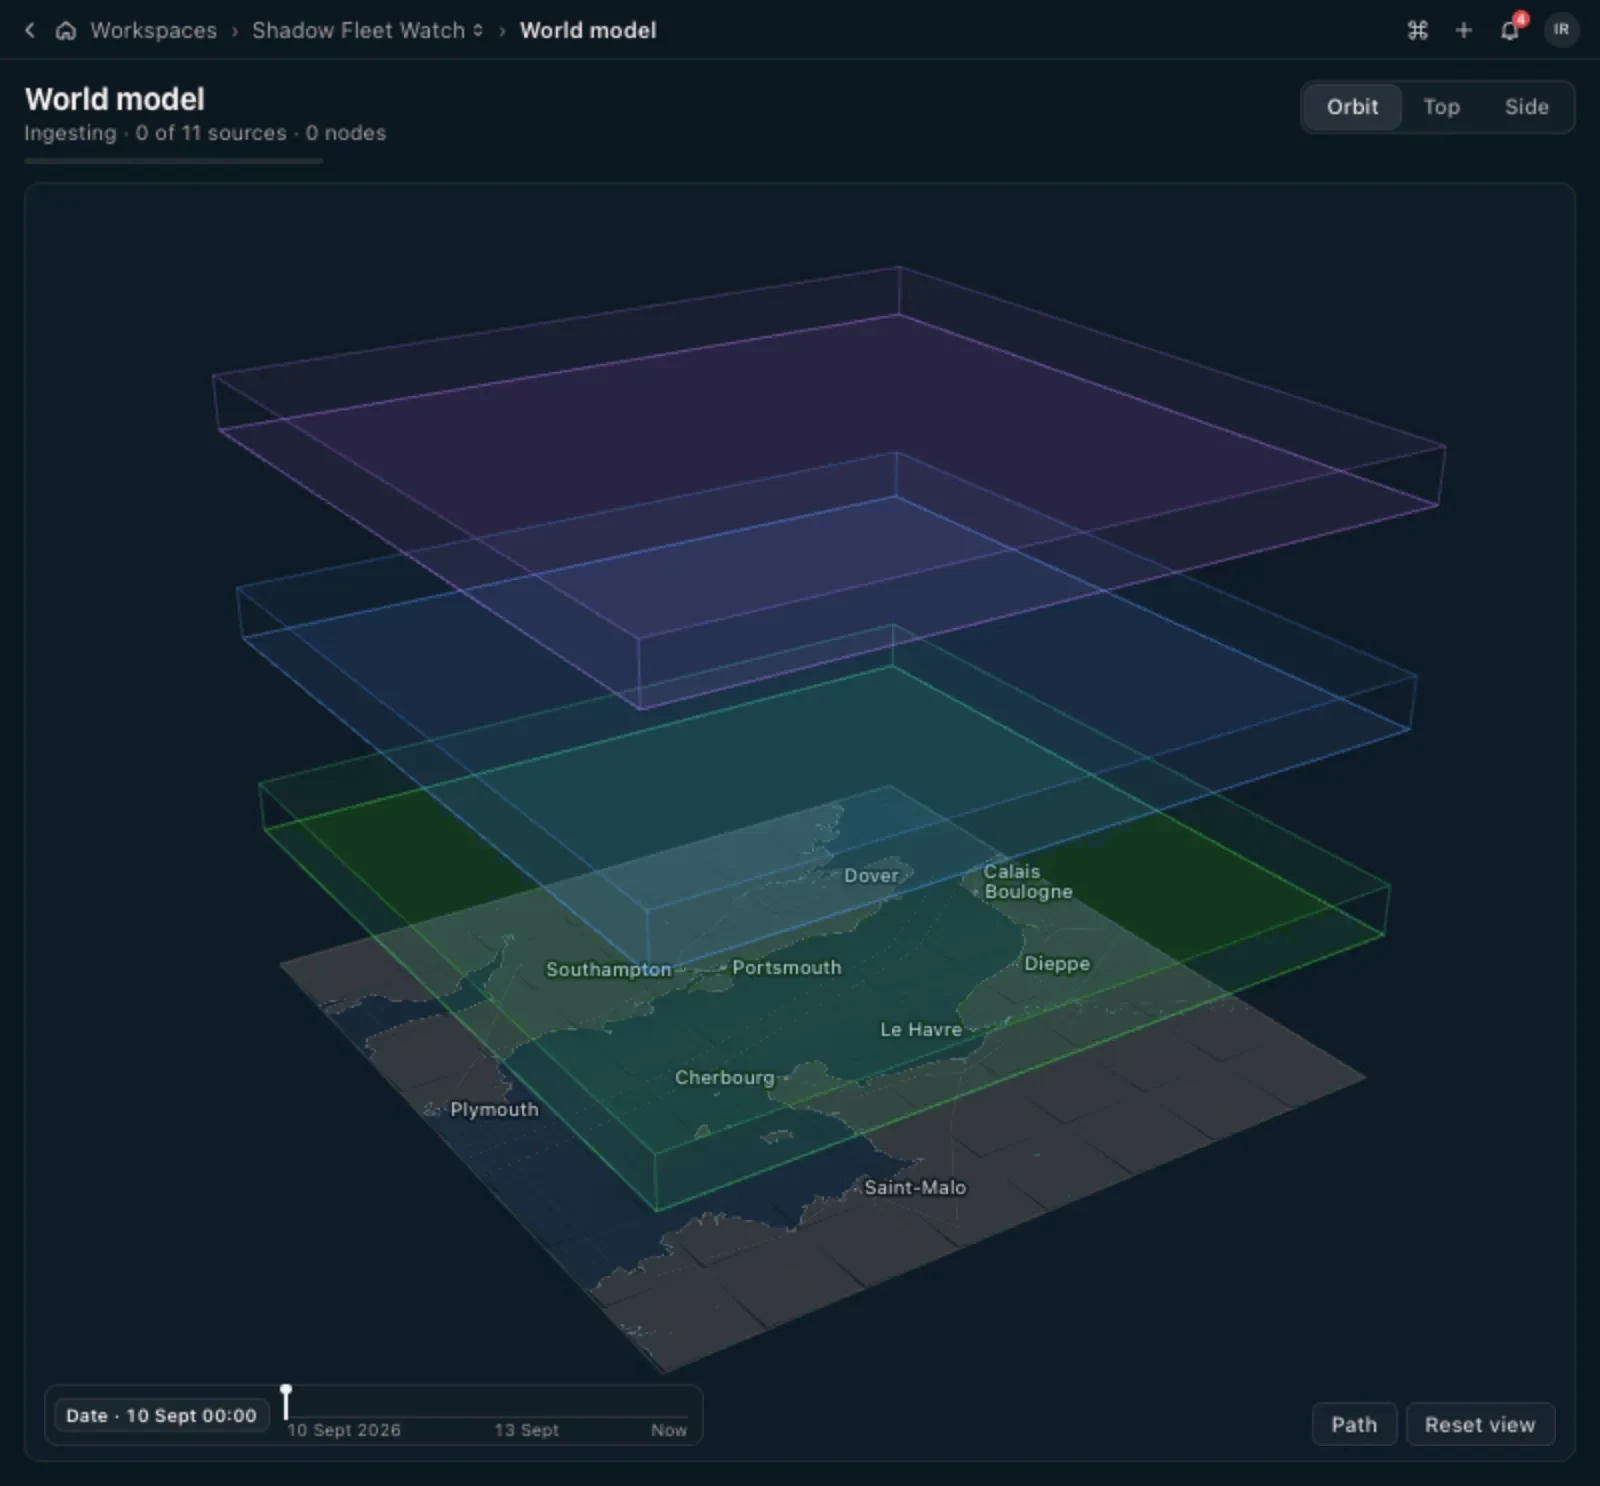
Diagram: eleven kinds of source data flow in from the left, in three groups. Structured: databases, spreadsheets and GIS. Unstructured: documents, imagery, comms and social media. Streaming: sensor feeds, streaming audio, full motion video and data streams. Every source converges on a single point, automated ingestion, which feeds the product window. The window shows the live knowledge graph, with the layered world model in a smaller card overlaid in the corner. The card is a button that swaps the two views; the toggle above the window does the same.